1. Respect the streak
Sometimes you have to step back and admire something, even if you're not sure whether it's good or bad.
Nebraska's six-year streak of four-loss seasons is simultaneously strong (that's nine or 10 wins every year, as Nebraska points out to recruits) and limiting (only one finish better than 20th in the polls). Bo Pelini's Huskers are consistently some level of good and almost never great, and that becomes frustrating to fans of any school after a while, much less a school with Nebraska's history of better-than-good finishes.
 More Huskers
More Huskers
Still, sometimes you just have to admire what had to happen for a streak like this to come about.
- In 2009-10, if the Huskers weren't great, they were close.They ranked 10th and 16th in the F/+ rankings but fell victim to just enough tight, frustrating losses -- 9-7 to Iowa State in a 2009 fumblefest, 13-12 to Texas in the controversial 2009 Big 12 title game, 20-13 to Texas at home in 2010 (Garrett Gilbert's lone shining moment in a Texas uniform), 9-6 at Texas A&M, 23-20 to Oklahoma in the Big 12 title game -- to finish 10-4 both years.
- In 2011, they weren't as good (28th) but whipped an 11-win Michigan State team and held off Penn State in Happy Valley to remain at only four losses (while a last-second loss to Northwestern kept them from three).
- In 2012, they improved to 19th but needed tight wins over Northwestern and Michigan State to get back to 10 wins and were prevented from getting an 11th by a close loss at UCLA.
- And in 2013, they very nearly fell apart; they dropped to 39th but beat Northwestern with a Hail Mary, held off Michigan and Penn State on the road, and upset Georgia in the Gator Bowl to somehow stay at four losses. They suffered some pretty dramatic turnovers luck (they almost lost three points per game to the turnovers fairy), but they went 5-0 in one-possession games all the same, and with the worst team of the Pelini era.
It's not easy to finish with basically the same record every year while your team's quality fluctuates so drastically from year to year. It's to the point where we look at the Huskers' schedule in the offseason and try to figure out which four games will be losses. (This year: at Michigan State, at Wisconsin, at Iowa, and at either Fresno State or Northwestern? Or maybe they beat Fresno State and Northwestern and lose in the bowl?)
This year, a relatively easy home slate should help immensely in the quest for 9-4 or better, as the roster itself is not very deep with breakthrough talent.
2. We might need to rename Glen Mason Territory
If you've read my previews for long enough, you've come to know the term Glen Mason Territory. I use it to describe when a coach brings solid results to a school but never really breaks through to the top level (or if he does, he doesn't do so for very long). Its namesake took Minnesota to seven bowls in eight years and twice finished in the AP top 20 at a school that hadn't finished a season ranked in nearly 40 years, but he was let go after seasons of 7-5, 7-5, and 6-7. The Gophers have had a winning record just twice in the seven years since.
It's probably pretty obvious where I'm going with this. Bo Pelini has never won fewer than nine games in Lincoln at a school that had only managed that feat twice in the six years before Pelini arrived. He has established a level of play the Huskers hadn't seen since the turn of the century, and while there has been fluctuation (10th in 2009, 39th in 2013), the Huskers are still winning.
But even though Nebraska has experienced the phenomenon of dumping a good coach because he's not great -- Frank Solich went 58-19 in six years at NU and got dumped after going 9-3 in 2003; he was replaced by Bill Callahan, who went 27-22 in four years -- one gets the impression that Pelini isn't going to last much longer without a breakthrough season. And that breakthrough season probably isn't going to be 2014.
2013 Schedule & Results
| Record: 9-4 | Adj. Record: 10-3 | Final F/+ Rk: 39 | |||||||
| Date | Opponent | Opp. F/+ Rk | Score | W-L | Adj. Score | Adj. W-L | 5-gm Adj. Avg. |
| 31-Aug | Wyoming | 102 | 37-34 | W | 32.7 - 41.8 | L | |
| 7-Sep | Southern Miss | 120 | 56-13 | W | 36.8 - 27.2 | W | |
| 14-Sep | UCLA | 15 | 21-41 | L | 20.2 - 33.4 | L | |
| 21-Sep | South Dakota State | N/A | 59-20 | W | 50.3 - 38.3 | W | |
| 5-Oct | Illinois | 71 | 39-19 | W | 35.1 - 19.8 | W | 2.9 |
| 12-Oct | at Purdue | 114 | 44-7 | W | 18.9 - 13.9 | W | 5.8 |
| 26-Oct | at Minnesota | 55 | 23-34 | L | 26.3 - 40.1 | L | 1.0 |
| 2-Nov | Northwestern | 59 | 27-24 | W | 26.6 - 24.8 | W | 4.0 |
| 9-Nov | at Michigan | 37 | 17-13 | W | 19.7 - 10.8 | W | 3.4 |
| 16-Nov | Michigan State | 6 | 28-41 | L | 57.1 - 22.0 | W | 7.4 |
| 23-Nov | at Penn State | 61 | 23-20 | W | 23.5 - 22.0 | W | 6.7 |
| 29-Nov | Iowa | 29 | 17-38 | L | 29.5 - 27.5 | W | 9.9 |
| 1-Jan | vs. Georgia | 22 | 24-19 | W | 24.7 - 16.2 | W | 11.2 |
| Category | Offense | Rk | Defense | Rk | Spec. Tms. | Rk |
| F/+ | +0.4% | 61 | +7.2% | 32 | +1.5% | 38 |
| Points Per Game | 31.9 | 48 | 24.8 | 51 | ||
| Adj. Points Per Game | 30.9 | 49 | 26.0 | 50 | ||
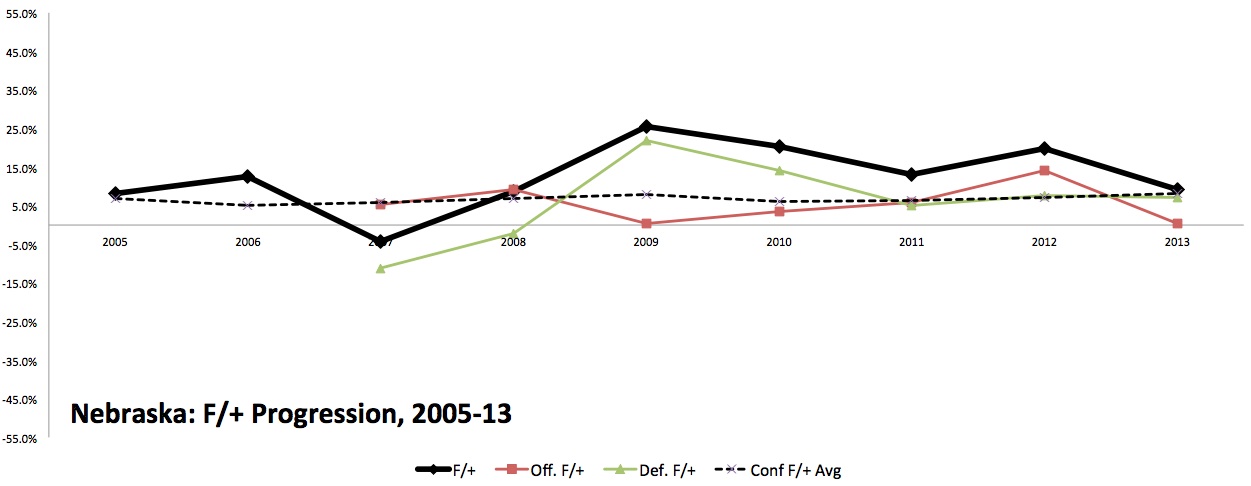
3. The defense clicked
Part of the frustration in the Pelini era has been that every unit has been great at some point. The offense ranked 18th in Off. F/+ in 2008 and eighth in 2012. The defense ranked fourth in Def. F/+ in 2009 and eighth in 2010. Special teams ranked in the top 20 of Special Teams F/+ from 2008-2011.
But when the defense was at its best, offense was a liability. When the offense got ironed out, the defense fell out of the top 20. And when the two units were at their combined best -- eighth in Off. F/+ and 30th in Def. F/+ in 2012 -- special teams fell apart (110th). This has been a cat-herding experience* for Pelini, who has to be more frustrated about this than Nebraska fans are.
* Cats. Pelini. Yeah, that was totally unintentional. Totally.
For the season as a whole, Nebraska's defense was only good in 2013 and didn't meet the greatness standard established in 2009-10. But after a brutal first month that saw the Huskers allow 6.9 yards per play to South Dakota State and 8.1 to Wyoming, the defense rounded into form.
- Adj. Points Per Game (first 5 games): Nebraska 35.0, Opponent 32.1 (plus-2.9)
- Adj. Points Per Game (next 4 games): Nebraska 22.9, Opponent 22.4 (plus-0.5)
- Adj. Points Per Game (last 4 games): Nebraska 33.7, Opponent 21.9 (plus-11.8)
The national average for yards per play was around 5.7 in 2013. In the final nine games of the season, Nebraska allowed more than 5.1 just once (strangely enough, it was to Minnesota) and allowed 4.8 or fewer six times. The Blackshirts became a bit of a punchline because of Wyoming and South Dakota State but got angry and got much, much better. That this surge coincided with defensive end Randy Gregory's breakout (0.5 sacks in the first five games, 9.0 in the next eight) probably isn't a coincidence.
Offense
| FIVE FACTORS -- OFFENSE | ||||||
| Raw Category | Rk | Opp. Adj. Category | Rk | |||
| EXPLOSIVENESS | IsoPPP | 1.06 | 102 | IsoPPP+ | 99.9 | 61 |
| EFFICIENCY | Succ. Rt. | 45.1% | 43 | Succ. Rt. + | 106.2 | 43 |
| FIELD POSITION | Def. Avg. FP | 31.5 | 101 | Def. FP+ | 95.4 | 103 |
| FINISHING DRIVES | Pts. Per Trip in 40 | 4.8 | 22 | Redzone S&P+ | 103.1 | 47 |
| TURNOVERS | EXPECTED | 25.6 | ACTUAL | 29 | +3.4 | |
| Category | Yards/ Game Rk |
S&P+ Rk | Success Rt. Rk |
PPP+ Rk |
| OVERALL | 59 | 43 | 43 | 43 |
| RUSHING | 19 | 24 | 19 | 18 |
| PASSING | 97 | 60 | 73 | 86 |
| Standard Downs | 44 | 34 | 68 | |
| Passing Downs | 49 | 50 | 58 |
| Q1 Rk | 29 | 1st Down Rk | 36 |
| Q2 Rk | 58 | 2nd Down Rk | 57 |
| Q3 Rk | 41 | 3rd Down Rk | 52 |
| Q4 Rk | 68 |
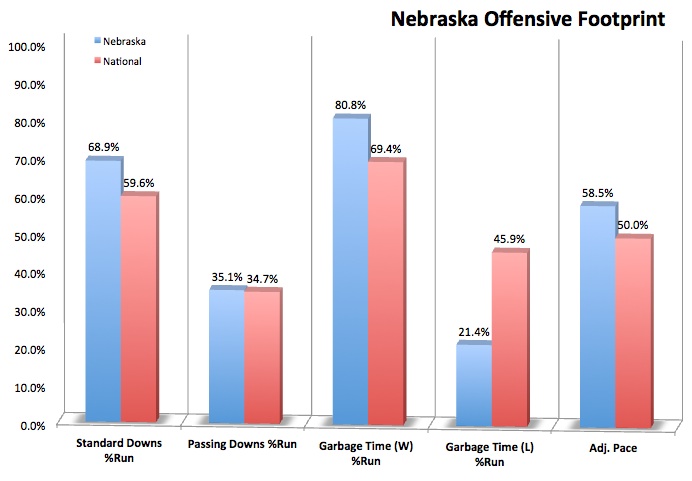
4. Tim Beck's job was more difficult in 2013
Everything came together for the 2012 Nebraska offense. Ameer Abdullah and (when healthy) Rex Burkhead gave the Huskers 1,826 rushing yards running behind a line that went from shaky to great with experience. Taylor Martinez was healthy enough to play all 14 games and found a tremendous play-action weapon in wideout Kenny Bell. Plus, offensive coordinator Tim Beck found an incredible play-calling rhythm, mixing a run-heavy approach with both play-action and quick, easy first-down passes. He mastered the art of keeping Martinez out of passing downs and in situations where, if he he was throwing the ball more than eight yards, it was to a really, really wide open receiver.
Life was more difficult in 2013. Martinez suffered a foot injury early in the year, limped through three games, missed three, came back for one week, and was done for the season. He was replaced, back and forth, by Ron Kellogg III and Tommy Armstrong, Jr. Kellog was as much a game manager as anything, rushing only 16 times but completing 80 passes with a 60-percent completion rate and two-percent interception rate, both perfectly reasonable. Armstrong, meanwhile, was more prone to both rushes and big pass plays (14.2 yards per completion to Kellogg's 11.5) but completed only 52 percent of his passes with an alarming 6 percent interception rate. Beck's play-calling shifted depending on who was behind center, and predictably, the results weren't quite as strong.
Martinez and Kellogg have both graduated, so it's sink-or-swim with the volatile Armstrong (and a completely rebuilt offensive line) in 2014.
Quarterback
Note: players in bold below are 2014 returnees. Players in italics are questionable with injury/suspension.
| Player | Ht, Wt | 2014 Year |
Rivals | Comp | Att | Yards | TD | INT | Comp Rate |
Sacks | Sack Rate | Yards/ Att. |
| Ron Kellogg III | 80 | 134 | 919 | 6 | 3 | 59.7% | 7 | 5.0% | 6.1 | |||
| Tommy Armstrong, Jr. | 6'1, 220 | So. | 3 stars (5.7) | 68 | 131 | 966 | 9 | 8 | 51.9% | 4 | 3.0% | 6.9 |
| Taylor Martinez | 69 | 110 | 667 | 10 | 2 | 62.7% | 6 | 5.2% | 5.4 | |||
| Ryker Fyfe | 6'2, 190 | So. | 2 stars (5.3) | |||||||||
| Johnny Stanton | 6'2, 225 | RSFr. | 3 stars (5.7) |
Running Back
| Player | Pos. | Ht, Wt | 2014 Year |
Rivals | Rushes | Yards | TD | Yards/ Carry |
Hlt Yds/ Carry |
Opp. Rate |
| Ameer Abdullah | RB | 5'9, 195 | Sr. | 3 stars (5.7) | 281 | 1690 | 9 | 6.0 | 5.4 | 43.8% |
| Imani Cross | RB | 6'1, 230 | Jr. | 3 stars (5.7) | 85 | 447 | 10 | 5.3 | 5.2 | 40.0% |
| Tommy Armstrong, Jr. | QB | 6'1, 220 | So. | 3 stars (5.7) | 63 | 235 | 2 | 3.7 | 3.5 | 38.1% |
| Terrell Newby | RB | 5'10, 195 | So. | 4 stars (6.0) | 54 | 298 | 2 | 5.5 | 3.7 | 44.4% |
| Taylor Martinez | QB | 34 | 159 | 0 | 4.7 | 4.9 | 47.1% | |||
| Ron Kellogg III | QB | 16 | 54 | 0 | 3.4 | 2.0 | 43.8% | |||
| King Frazier | RB | 12 | 44 | 1 | 3.7 | 2.0 | 50.0% | |||
| Graham Nabity | RB | 6'0, 210 | So. | NR | 5 | 24 | 0 | 4.8 | 0.8 | 60.0% |
| Adam Taylor | RB | 6'2, 210 | RSFr. | 4 stars (5.8) | ||||||
| Mikale Wilbon | RB | 5'8, 190 | Fr. | 4 stars (5.8) |
5. Steady Ameer
The quarterback is a volatile sophomore. The go-to wideout (Kenny Bell) had a great sophomore season and a wholly mediocre junior campaign; the other receiving options are almost all sophomores. The line returns 16 career starts, one of the lowest marks in the country. The Nebraska offense is in pretty serious flux right now, but with all the uncertainty, the Huskers at least have Ameer Abdullah.
Only 16 FBS players carried the ball at least 250 times in 2013. Of those 16, only six averaged 5.43 or greater Highlight Yards per opportunity. Of those six, only three had a 43 percent Opportunity Rate: NIU quarterback Jordan Lynch, Western Kentucky's Antonio Andrews, and Abdullah. Washington's Bishop Sankey (5.44 per opportunity, 42 percent opportunity rate) came close to that mark, but of the country's most durable backs, Abdullah had the best combination of explosiveness and efficiency.
The mobile Armstrong could help to take attention off of him (even though he's not nearly as explosive as Martinez), and when he needs to be spelled, he has a stable of high-quality backups. But he is the surest thing on an offense in need of sure things.
Receiving Corps
| Player | Pos. | Ht, Wt | 2014 Year |
Rivals | Targets | Catches | Yards | Catch Rate | Target Rate |
%SD | Yds/ Target |
NEY | Real Yds/ Target |
RYPR |
| Quincy Enunwa | WR-Z | 96 | 51 | 753 | 53.1% | 26.8% | 46.7% | 7.8 | 69 | 7.7 | 91.1 | |||
| Kenny Bell | WR-X | 6'1, 185 | Sr. | 3 stars (5.7) | 88 | 52 | 577 | 59.1% | 24.6% | 50.6% | 6.6 | -81 | 6.8 | 69.8 |
| Ameer Abdullah | RB | 5'9, 195 | Sr. | 3 stars (5.7) | 30 | 26 | 232 | 86.7% | 8.4% | 45.8% | 7.7 | -42 | 7.1 | 28.1 |
| Jordan Westerkamp | WR-A | 6'0, 195 | So. | 4 stars (5.8) | 25 | 20 | 283 | 80.0% | 7.0% | 30.4% | 11.3 | 65 | 11.2 | 34.3 |
| Sam Burtch | WR-A | 6'3, 195 | Jr. | NR | 22 | 12 | 147 | 54.5% | 6.1% | 61.9% | 6.7 | -12 | 5.7 | 17.8 |
| Cethan Carter | TE | 6'4, 240 | So. | 3 stars (5.6) | 19 | 10 | 127 | 52.6% | 5.3% | 64.7% | 6.7 | -8 | 5.7 | 15.4 |
| Jamal Turner | WR-A | 6'1, 185 | Sr. | 4 stars (5.8) | 19 | 13 | 102 | 68.4% | 5.3% | 47.4% | 5.4 | -51 | 5.3 | 12.3 |
| Jake Long | TE | 14 | 8 | 121 | 57.1% | 3.9% | 41.7% | 8.6 | 18 | 9.8 | 14.6 | |||
| Alonzo Moore | WR-Z | 6'2, 185 | So. | 4 stars (5.8) | 11 | 6 | 75 | 54.5% | 3.1% | 60.0% | 6.8 | -4 | 5.4 | 9.1 |
| Taariq Allen | WR-Z | 6'3, 200 | Jr. | 3 stars (5.5) | 7 | 3 | 22 | 42.9% | 2.0% | N/A | 3.1 | -24 | 0.0 | 2.7 |
| Imani Cross | RB | 6'1, 230 | Jr. | 3 stars (5.7) | 6 | 4 | 13 | 66.7% | 1.7% | 60.0% | 2.2 | -35 | 2.2 | 1.6 |
| Sam Cotton | TE | 6'4, 250 | So. | 3 stars (5.5) | 5 | 3 | 22 | 60.0% | 1.4% | 100.0% | 4.4 | -16 | 2.4 | 2.7 |
| Brandon Reilly | WR-X | 6'1, 195 | So. | NR | 4 | 3 | 24 | 75.0% | 1.1% | 66.7% | 6.0 | -10 | 6.9 | 2.9 |
| Terrell Newby | RB | 5'10, 195 | So. | 4 stars (6.0) | 4 | 3 | 1 | 75.0% | 1.1% | 0.0% | 0.3 | -33 | 0.9 | 0.1 |
| Kevin Gladney | WR | 6'1, 185 | So. | 3 stars (5.7) | ||||||||||
| Christian Bailey | WR | 5'11, 195 | So. | NR | ||||||||||
| Lane Hovey | WR | 6'4, 205 | So. | NR | ||||||||||
| Monte Harrison | WR | 6'2, 205 | Fr. | 4 stars (5.8) |
Offensive Line
| Category | Adj. Line Yds |
Std. Downs LY/carry |
Pass. Downs LY/carry |
Opp. Rate |
Power Success Rate |
Stuff Rate |
Adj. Sack Rate |
Std. Downs Sack Rt. |
Pass. Downs Sack Rt. |
| Team | 107.4 | 3.09 | 3.24 | 42.5% | 71.1% | 16.6% | 120.2 | 3.5% | 5.5% |
| Rank | 38 | 46 | 68 | 29 | 48 | 23 | 47 | 35 | 49 |
| Player | Pos. | Ht, Wt | 2014 Year |
Rivals | Career Starts | Honors/Notes |
| Cole Pensick | C | 12 | 2nd All-Big Ten | |||
| Jeremiah Sirles | RT | 41 | ||||
| Spencer Long | RG | 33 | ||||
| Andrew Rodriguez | RG | 21 | ||||
| Brent Qvale | LT | 18 | ||||
| Jake Cotton | LG | 6'6, 305 | Sr. | 2 stars (5.3) | 11 | |
| Mike Moudy | RG | 6'5, 305 | Sr. | 3 stars (5.7) | 3 | |
| Mark Pelini | C | 6'0, 290 | Sr. | NR | 2 | |
| Matt Finnin | LT | 6'7, 305 | Sr. | 3 stars (5.7) | 0 | |
| Ryne Reeves | LG | 6'3, 300 | Jr. | 4 stars (5.8) | 0 | |
| Zach Sterup | RT | 6'8, 315 | Jr. | 4 stars (5.8) | 0 | |
| Givens Price | RG | 6'4, 305 | Jr. | NR | 0 | |
| Paul Thurston | C | 6'5, 290 | So. | 4 stars (5.8) | 0 | |
| David Knevel | OT | 6'9, 305 | RSFr. | 3 stars (5.7) | ||
| Zach Hannon | OL | 6'5, 300 | RSFr. | 3 stars (5.7) | ||
| Alex Lewis (Colorado) | OL | 6'6, 290 | Jr. | 3 stars (5.5) | ||
| Tanner Farmer | OL | 6'4, 315 | Fr. | 4 stars (5.9) | ||
| Nick Gates | OL | 6'5, 275 | Fr. | 4 stars (5.8) | ||
| Jerald Foster | OL | 6'3, 312 | Fr. | 3 stars (5.7) |
6. So ... about that line...
The offensive line was the unsung hero of 2012. Granted, Martinez's magic running and Beck's play-calling helped, but the Huskers ranked fourth in Adj. Line Yards in 2012. Even after losing Martinez and guard Spencer Long, they still ranked a healthy 38th last year. (And with someone other than Martinez doing most of the passing, the sack rates improved.)
In 2014, the line starts over. Gone are five players with 125 starts on their résumés. Cole Pensick was all-conference in 2013, and Jeremiah Sirles and Long were all-conference in 2012. This was an effective, experienced unit. In theory, as many as four seniors could start this year, but they're four seniors with barely a year of starting experience between them. We'll get to see just how good Abdullah is this year, I guess.
Defense
| FIVE FACTORS -- DEFENSE | ||||||
| Raw Category | Rk | Opp. Adj. Category | Rk | |||
| EXPLOSIVENESS | IsoPPP | 1.09 | 39 | IsoPPP+ | 102.3 | 51 |
| EFFICIENCY | Succ. Rt. | 42.6% | 62 | Succ. Rt. + | 97.5 | 65 |
| FIELD POSITION | Off. Avg. FP | 28.5 | 99 | Off. FP+ | 94.5 | 112 |
| FINISHING DRIVES | Pts. Per Trip in 40 | 3.9 | 43 | Redzone S&P+ | 109.6 | 25 |
| TURNOVERS | EXPECTED | 21.3 | ACTUAL | 18.0 | -3.3 | |
| Category | Yards/ Game Rk |
S&P+ Rk | Success Rt. Rk |
PPP+ Rk |
| OVERALL | 40 | 57 | 65 | 60 |
| RUSHING | 54 | 84 | 87 | 74 |
| PASSING | 32 | 41 | 35 | 34 |
| Standard Downs | 88 | 88 | 53 | |
| Passing Downs | 25 | 11 | 87 |
| Q1 Rk | 89 | 1st Down Rk | 96 |
| Q2 Rk | 34 | 2nd Down Rk | 31 |
| Q3 Rk | 53 | 3rd Down Rk | 7 |
| Q4 Rk | 30 |
Defensive Line
| Category | Adj. Line Yds |
Std. Downs LY/carry |
Pass. Downs LY/carry |
Opp. Rate |
Power Success Rate |
Stuff Rate |
Adj. Sack Rate |
Std. Downs Sack Rt. |
Pass. Downs Sack Rt. |
| Team | 94 | 3.05 | 3.04 | 38.2% | 61.4% | 19.6% | 138.5 | 8.2% | 9.1% |
| Rank | 88 | 78 | 38 | 49 | 29 | 56 | 11 | 3 | 20 |
| Name | Pos | Ht, Wt | 2014 Year |
Rivals | GP | Tackles | % of Team | TFL | Sacks | Int | PBU | FF | FR |
| Randy Gregory | DE | 6'6, 245 | Jr. | 3 stars (5.5) | 13 | 52.0 | 7.4% | 16.0 | 9.5 | 1 | 1 | 1 | 1 |
| Jason Ankrah | DE | 13 | 28.0 | 4.0% | 7.5 | 4.0 | 1 | 3 | 2 | 0 | |||
| Avery Moss | DE | 12 | 27.5 | 3.9% | 6.5 | 4.5 | 1 | 1 | 0 | 0 | |||
| Thad Randle | DT | 11 | 23.0 | 3.3% | 3.0 | 1.0 | 0 | 0 | 0 | 0 | |||
| Aaron Curry | DT | 6'1, 280 | Jr. | 3 stars (5.6) | 13 | 18.5 | 2.6% | 3.0 | 2.0 | 0 | 0 | 0 | 0 |
| Vincent Valentine | DT | 6'3, 320 | So. | 3 stars (5.7) | 13 | 16.5 | 2.3% | 4.0 | 1.0 | 0 | 0 | 0 | 0 |
| Greg McMullen | DE | 6'3, 280 | So. | 4 stars (5.8) | 11 | 12.5 | 1.8% | 3.0 | 1.0 | 0 | 0 | 1 | 0 |
| Maliek Collins | DT | 6'2, 300 | So. | 3 stars (5.7) | 12 | 9.0 | 1.3% | 1.5 | 1.0 | 0 | 0 | 1 | 0 |
| Kevin Williams (2012) | DT | 6'2, 280 | Jr. | 3 stars (5.7) | 5 | 2.5 | 0.3% | 0.5 | 0.0 | 0 | 0 | 0 | 0 |
| Kevin Maurice | DT | 6'3, 280 | So. | 3 stars (5.7) | 6 | 2.0 | 0.3% | 0.0 | 0.0 | 0 | 0 | 0 | 0 |
| A.J. Natter | DE | 6'5, 240 | RSFr. | 3 stars (5.7) | |||||||||
| Joe Keels | DE | 6'3, 250 | Jr. | 3 stars (5.7) | |||||||||
| Peyton Newell | DE | 6'3, 285 | Fr. | 3 stars (5.7) |
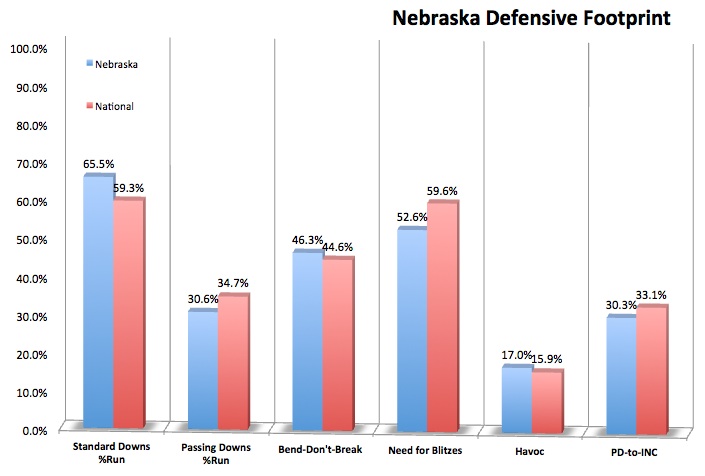
7. Randy will need help
Randy Gregory was a four-star JUCO transfer, so it's not like he was completely unheralded by any means. But needless to say, his profile has grown dramatically in a small amount of time. Or to put it another way, nobody saw this coming 12 months ago.
Once Gregory got up to speed following a flat September, he was almost unstoppable, and he made a significant difference on a team looking for play-makers up front. Nebraska's defense over the final two months of the season was as close as the Huskers have come to their 2009-10 level since Prince Amukamara left town.
In 2014, Gregory will have a new supporting cast around him. Jason Ankrah and Avery Moss were decent ends in their own right, and Thad Randle was the steadiest in last year's batch of tackles. Players like tackle Vincent Valentine and end Greg McMullen are young and full of potential, and another JUCO transfer joins the ranks (Joe Keels), but Gregory is the only known entity of the bunch, and this was already a line that struggled mightily against run blocking (11th in Adj. Sack Rate but 88th in Adj. Line Yards).
At least the linebackers are solid. This is probably the most high-upside set of LBs the Huskers have had in quite a while, with three returning starters combining for 17 tackles for loss, five sacks, and some deflections last fall. Run defense will almost certainly continue to be an issue in 2014, but the athleticism and potential for help in pass defense is still pretty high.
Linebackers
| Name | Pos | Ht, Wt | 2014 Year |
Rivals | GP | Tackles | % of Team | TFL | Sacks | Int | PBU | FF | FR |
| David Santos | BUCK | 6'0, 225 | Jr. | 4 stars (5.8) | 13 | 67.5 | 9.6% | 6.5 | 2.0 | 0 | 2 | 0 | 0 |
| Michael Rose | MIKE | 5'11, 240 | So. | 3 stars (5.7) | 12 | 51.5 | 7.3% | 5.0 | 0.0 | 0 | 1 | 0 | 0 |
| Zaire Anderson | WILL | 5'11, 220 | Sr. | 4 stars (5.8) | 12 | 40.0 | 5.7% | 5.5 | 3.0 | 0 | 1 | 0 | 0 |
| Josh Banderas | MIKE | 6'2, 235 | So. | 4 stars (5.8) | 13 | 20.0 | 2.8% | 2.5 | 2.0 | 0 | 1 | 0 | 0 |
| Jared Afalava | LB | 4 | 9.5 | 1.3% | 2.0 | 1.0 | 0 | 0 | 0 | 0 | |||
| Colby Starkebaum | LB | 13 | 4.5 | 0.6% | 0.0 | 0.0 | 0 | 0 | 0 | 0 | |||
| Trevor Roach (2012) |
LB | 6'2, 235 | Sr. | NR | 5 | 3.0 | 0.4% | 0.5 | 0.5 | 0 | 0 | 0 | 0 |
| Austin Williams | LB | 6'0, 200 | Sr. | NR | 10 | 2.0 | 0.3% | 0.0 | 0.0 | 0 | 0 | 2 | 0 |
| Marcus Newby | LB | 6'1, 215 | RSFr. | 4 stars (5.8) | |||||||||
| Courtney Love | LB | 6'1, 240 | RSFr. | 3 stars (5.7) |
Secondary
| Name | Pos | Ht, Wt | 2014 Year |
Rivals | GP | Tackles | % of Team | TFL | Sacks | Int | PBU | FF | FR |
| Corey Cooper | SS | 6'1, 215 | Sr. | 4 stars (5.8) | 13 | 71.5 | 10.2% | 4 | 2 | 1 | 1 | 1 | 0 |
| Ciante Evans | CB | 13 | 38.0 | 5.4% | 10.5 | 3 | 4 | 6 | 1 | 0 | |||
| Andrew Green | FS | 13 | 36.0 | 5.1% | 1.5 | 0 | 0 | 3 | 0 | 0 | |||
| Stanley Jean-Baptiste | CB | 13 | 34.0 | 4.8% | 3 | 1 | 4 | 12 | 0 | 0 | |||
| LeRoy Alexander | FS | 6'0, 200 | So. | 3 stars (5.6) | 13 | 31.0 | 4.4% | 1 | 0 | 1 | 1 | 0 | 1 |
| Josh Mitchell | CB | 5'11, 160 | Sr. | 3 stars (5.6) | 13 | 27.0 | 3.8% | 3 | 0 | 1 | 6 | 0 | 0 |
| Harvey Jackson | FS | 10 | 26.5 | 3.8% | 1 | 0 | 0 | 0 | 0 | 0 | |||
| Nathan Gerry | FS | 6'2, 210 | So. | 3 stars (5.7) | 13 | 25.0 | 3.6% | 2 | 0 | 0 | 0 | 0 | 0 |
| Mohammed Seisay | CB | 12 | 8.5 | 1.2% | 1 | 0 | 0 | 1 | 0 | 0 | |||
| Charles Jackson | S | 5'11, 180 | Jr. | 4 stars (5.8) | 13 | 5.0 | 0.7% | 0 | 0 | 0 | 0 | 1 | 0 |
| Wil Richards | S | 7 | 4.0 | 0.6% | 0 | 0 | 0 | 0 | 0 | 0 | |||
| Jonathan Rose | CB | 6'1, 190 | Jr. | 4 stars (5.8) | |||||||||
| Daniel Davie | CB | 6'1, 185 | Jr. | 3 stars (5.5) | |||||||||
| D.J. Singleton | S | 6'1, 200 | RSFr. | 3 stars (5.7) | |||||||||
| Boaz Joseph | CB | 6'1, 190 | RSFr. | 3 stars (5.6) | |||||||||
| Drake Martinez | S | 6'2, 195 | RSFr. | 3 stars (5.5) | |||||||||
| Byerson Cockrell | DB | 6'0, 185 | Jr. | 2 stars (5.4) |
8. A lot of play-making out the door
An elite pass rush helped out, but the pass defense was pretty solid on its own in 2013. Ciante Evans pulled an incredibly rare feat (10+ TFLs by a defensive back), while Evans and Stanley Jean-Baptiste combined to pick off eight passes and break up another 18. Again, this was the most active, exciting defense NU has had since 2010, and like 2010, the secondary was deep and athletic.
It's less deep in 2014. Steady safety Corey Cooper returns, as do two sophomore safeties (LeRoy Alexander and Nathan Gerry) and a senior corner (Josh Mitchell) who got quite a bit of playing time last fall. But Evans and Jean-Baptiste are gone, as are safeties Andrew Green and Harvey Jackson. Mitchell has potential in terms of getting his hands on passes, and Gerry seems pretty good near the line of scrimmage, but the depth has vanished unless some redshirt freshmen are ready to make a difference from the start of the year.
Special Teams
| Punter | Ht, Wt | 2014 Year |
Punts | Avg | TB | FC | I20 | FC/I20 Ratio |
| Sam Foltz | 6'1, 205 | So. | 71 | 41.6 | 7 | 16 | 22 | 53.5% |
| Kicker | Ht, Wt | 2014 Year |
Kickoffs | Avg | TB | OOB | TB% |
| Mauro Bondi | 6'0, 205 | Jr. | 77 | 63.2 | 48 | 1 | 62.3% |
| Place-Kicker | Ht, Wt | 2014 Year |
PAT | FG (0-39) |
Pct | FG (40+) |
Pct |
| Pat Smith | 43-45 | 8-8 | 100.0% | 4-5 | 80.0% | ||
| Mauro Bondi | 6'0, 205 | Jr. | 7-8 | 1-1 | 100.0% | 0-0 | N/A |
| Returner | Pos. | Ht, Wt | 2014 Year |
Returns | Avg. | TD |
| Kenny Bell | KR | 6'1, 185 | Sr. | 23 | 26.5 | 1 |
| Alonzo Moore | KR | 6'2, 185 | So. | 5 | 23.2 | 0 |
| Jordan Westerkamp | PR | 6'0, 195 | So. | 19 | 2.7 | 0 |
| Jamal Turner | PR | 6'1, 185 | Sr. | 2 | 3.0 | 0 |
| Category | Rk |
| Special Teams F/+ | 38 |
| Field Goal Efficiency | 13 |
| Punt Return Efficiency | 97 |
| Kick Return Efficiency | 36 |
| Punt Efficiency | 46 |
| Kickoff Efficiency | 77 |
| Opponents' Field Goal Efficiency | 98 |
9. A field position nightmare
Nebraska's special teams ratings bounced back pretty far after a surprisingly awful 2012, but it was mostly because of place-kicker Pat Smith, who was mostly automatic on kicks under 40 yards. Punting and kick returns were alright, but between kickoffs (lots of touchbacks missed with some breakdowns), punt returns, the offense's propensity for costly turnovers, and a defense that didn't quite force enough three-and-outs, Nebraska was quite bad in the field position battle. They were 98th in the country in Field Position Margin (minus-3.0 yards per drive) and got even worse in conference play (minus-4.6, ahead of only Illinois).
Finding a new punt returner might not be a bad idea, but with potentially the same offensive volatility and struggles on run defense, Nebraska might be destined to lose the field position battle again in 2014.
2014 Schedule & Projection Factors
| 2014 Schedule | ||
| Date | Opponent | Proj. Rk |
| 30-Aug | Florida Atlantic | 89 |
| 6-Sep | McNeese State | NR |
| 13-Sep | at Fresno State | 48 |
| 20-Sep | Miami | 30 |
| 27-Sep | Illinois | 63 |
| 4-Oct | at Michigan State | 13 |
| 18-Oct | at Northwestern | 50 |
| 25-Oct | Rutgers | 78 |
| 1-Nov | Purdue | 108 |
| 15-Nov | at Wisconsin | 15 |
| 22-Nov | Minnesota | 73 |
| 28-Nov | at Iowa | 34 |
| Five-Year F/+ Rk | 17.6% (21) |
| Two-Year Recruiting Rk | 22 |
| TO Margin/Adj. TO Margin* | -11 / -4.3 |
| TO Luck/Game | -2.6 |
| Approx. Ret. Starters (Off. / Def.) | 11 (5, 6) |
10. A hell of a road slate
Nebraska has a schedule similar to Michigan's: a ton of winnable home games mixed with a nearly impossible road slate.
Of the four projected top-35 teams on the slate, three host the Huskers (as does an athletic Fresno State squad); meanwhile, six of seven home opponents project worse than 60th. (McNeese State was a pretty damn good FCS team and just added Kansas State's Daniel Sams, by the way, but ... no.)
That sounds like a four-loss season to me.
My first impression is that Nebraska will top last year's No. 39 F/+ ranking, but mainly because the Huskers were quite a bit better than that over the last nine games. It's hard to imagine this team, with both lines and the secondary getting rebuilt, will be able to crack the top 20 or top 25.
And this puts Pelini (and his bosses) in an awkward situation. Pelini has won the last two offseasons -- first thanks to Jack Hoffman, then thanks to @FauxPelini -- but he's probably running out of time in search for a breakthrough, and it's hard to see a breakthrough happening in 2014.
Replies